The Runoff Coefficient describes the percentage of rainfall which runs off a particular surface during a storm event. The higher the value, the greater the quantity of water which will need to be dealt with by the drainage system.
Rational Method Runoff Coefficient Applications
This value is required for the rational method which simply multiplies the catchment area by the rainfall intensity. This value needs to be modified to take account of the characteristics of the surfacing. The runoff coefficient value is an attempt to take account of the volume of runoff which is absorbed into the surface.
This is not a very precise variable and as such attempts have been made to remove it using statistical analysis of historical events. However, for some simple applications or where better data is unavailable, an estimate of the runoff coefficient may be required. Obtaining an appropriate runoff coefficient requires considerable experience and judgement, and a number of factors must be considered.
Determining the Runoff Coefficient
The runoff coefficient chosen should include for the following factors;
- Surfacing materials – different man-made surfacing materials have different permeability values. Concrete and asphalt have low permeability values in a storm event, concrete block paving is relatively permeable. Typical values for common materials are given in the table below.
- Surfacing Age & Condition – New asphalt is considerably more permeable than old worn asphalt. Similarly old cracked concrete surfacing is more permeable than new uncracked concrete. This can increase/decrease the runoff coefficient by around 0.10 depending on the likely design life of the surfacing.
- Ground slope – The steeper the gradient, the more water will runoff the surface. This is one of the most important variables when calculating likely runoff. When using the below table it is advised that flat areas use the lower bound, areas with a slope greater than 6% should use the higher bound with intermediate slopes interpolated from the two values.
- Depressions – Any depressions in the ground will naturally attenuate the runoff, and can sometimes have a significant effect on the overall catchment runoff characteristics. This should be considered on a catchment by catchment basis, particularly for rural catchments.
- Underlying soils – This has a limited impact on man-made surfaces such as pavements, but has a very large effect on natural or agricultural surfaces. Common soil types are detailed in the table below.
- Vegetation – Dense vegetation on a rural surface can intercept and store a significant amount of rainfall, thereby reducing the catchment runoff.
- Antecedent wetness of the surface – for design purposes it is usually assumed that the surface is saturated or nearly saturated at the start of the storm event. When modeling summer rains or historical events, this may need to be considered in more detail.
- Rainfall depth – More intense rainfall events can lead to a higher percentage runoff as the surface becomes saturated while the storm is ongoing. For storm events with an intensity more than 50mm/hr, the upper bound value should be used from the table below.
- Burned Soil – Wildfires can cause calcification of the soil leading to a drop in permeability. This can be a factor in areas where wildfires are common.
- Frozen soil – Similarly in cold areas frozen soil in winter can reduce the permeability of the soil, increasing the runoff from a winter storm event.
In simple cases for new developments, it is often appropriate to assume 100% runoff from man-made or impermeable surfaces rather than spend a long time getting a value in the 90s which includes a lot of assumptions, simplifications and guesswork.
Typical Runoff Coefficient Table
| Rural Land Use | Lower Bounds | Upper Bounds |
| Cultivated Land, Sand & Gravel Soils | 0.25 | 0.35 |
| Cultivated Land, Sandy Loam Soils | 0.20 | 0.52 |
| Cultivated Land, Clay & Silt Loam Soils | 0.40 | 0.72 |
| Cultivated Land, Tight Clay Soils | 0.50 | 0.82 |
| Pasture, Sandy Loam Soils | 0.10 | 0.22 |
| Pasture, Clay & Silt Loam Soils | 0.30 | 0.42 |
| Pasture, Tight Clay Soils | 0.40 | 0.60 |
| Meadow | 0.10 | 0.50 |
| Woodland, Sandy Loam Soils | 0.10 | 0.30 |
| Woodland, Clay & Silt Loam Soils | 0.30 | 0.50 |
| Woodland, Tight Clay Soils | 0.40 | 0.60 |
| Bare Rock | 0.82 | 0.94 |
| Desert | 0.30 | 0.55 |
| Urban Land Use | Lower Bounds | Upper Bounds |
| Parking | 0.85 | 0.96 |
| Commercial | 0.71 | 0.89 |
| Streets | 0.70 | 0.91 |
| Industrial | 0.67 | 0.86 |
| Residential Lots, High Density | 0.25 | 0.54 |
| Residential Lots, Medium Density | 0.19 | 0.50 |
| Residential Lots, Low Density | 0.14 | 0.46 |
| Railway Yards | 0.20 | 0.35 |
| Playgrounds | 0.20 | 0.30 |
| Sports Fields | 0.20 | 0.35 |
| Parks | 0.10 | 0.25 |
| Cemetaries | 0.10 | 0.25 |
| Man Made Surfaces | Lower Bounds | Upper Bounds |
| Roofs, Steeply Sloping | 0.90 | 0.95 |
| Roofs, Small Flat | 0.90 | 0.95 |
| Roofs, Large Flat | 0.75 | 0.95 |
| Asphalt | 0.70 | 0.95 |
| Pervious Asphalt | 0.55 | 0.80 |
| Concrete | 0.70 | 0.95 |
| Pervious Concrete | 0.60 | 0.80 |
| Concrete Blocks, Uncemeted Joints | 0.50 | 0.70 |
| Concrete Blocks, Cemeted Joints | 0.70 | 0.85 |
| Gravel | 0.50 | 0.60 |
| Earth | 0.50 | 0.50 |
| Grass, Poor Condition | 0.32 | 0.62 |
| Grass, Fair Condition | 0.25 | 0.60 |
| Grass, Good Condition | 0.21 | 0.58 |
| Turf Block | 0.15 | 0.30 |
Related Spreadsheets from CivilWeb;
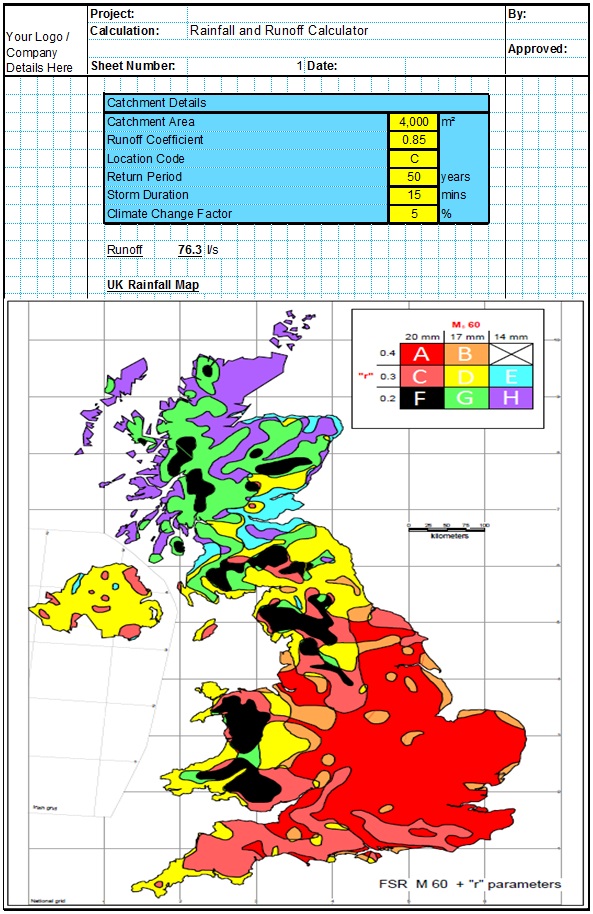
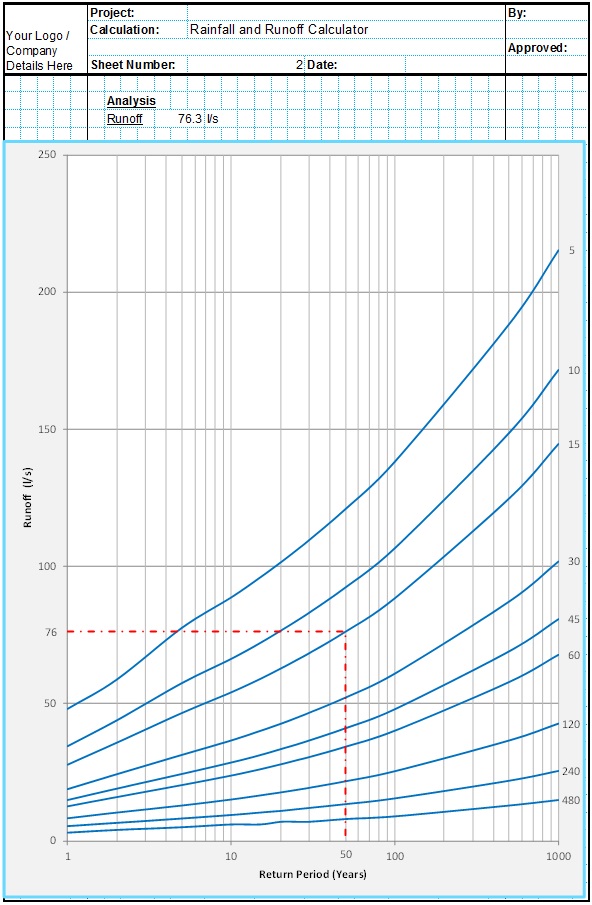
Runoff Calculator Spreadsheet
This spreadsheet calculates the design runoff flow for a site in accordance with the a number of different methods including the Wallingford Procedure.
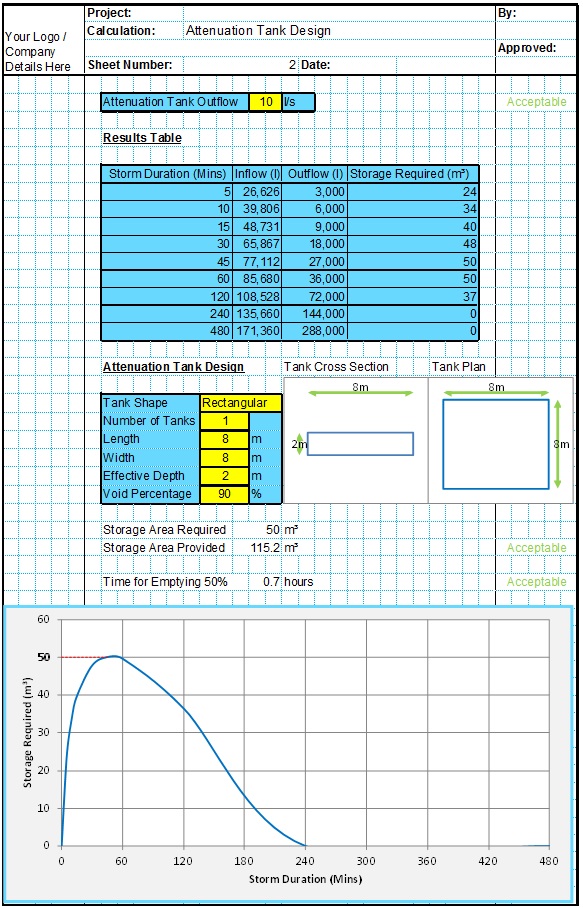
Attenuation Design Spreadsheet
This spreadsheet calculates the requirements for a attenuation system and assists the user to design a suitable system.
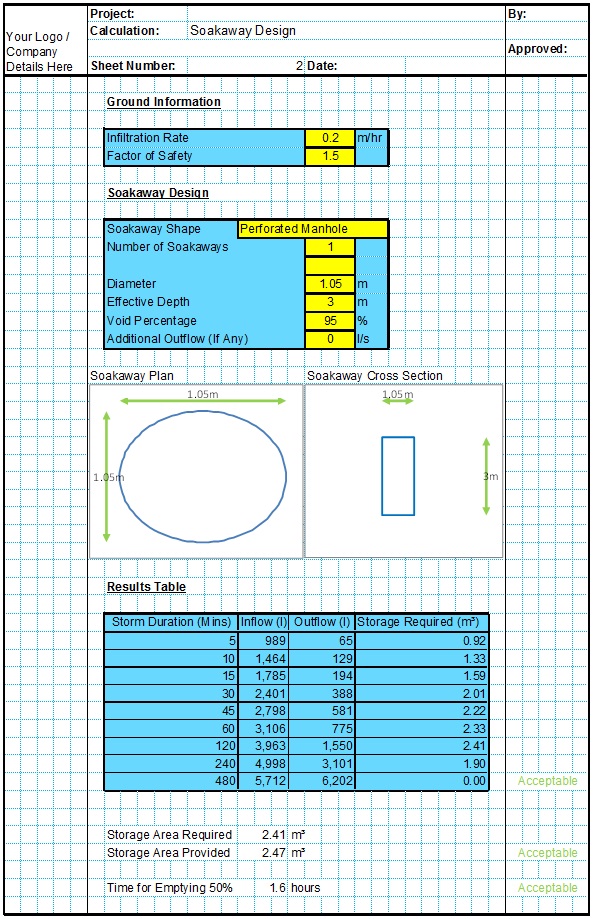
Soakaway Design Spreadsheet
This spreadsheet calculates the requirements for a soakaway system and assists the user to design a suitable system.
Full Drainage Design Suite
Full drainage design suite (50% Discount) including 7 spreadsheets;
- Colebrook White Pipe Design
- Manning Pipe Design
- Manning Open Channel Design
- Linear Drainage Design
- Runoff Calculator
- Attenuation Design
- Soakaway Design


