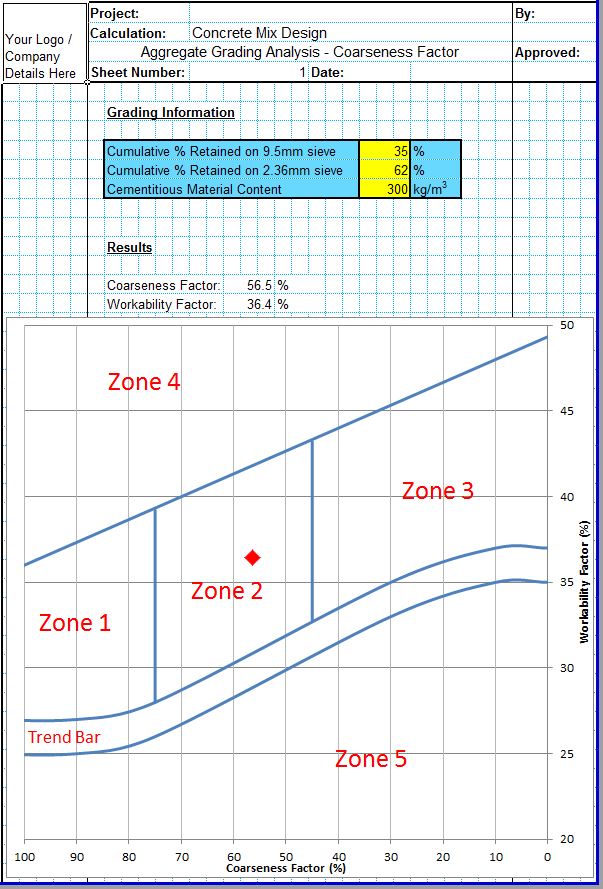
The Coarseness Factor Chart Excel Spreadsheet is included within the CivilWeb Grading of Aggregates in Concrete Analysis excel spreadsheet as a method of analyzing the suitability of an aggregate grading for a concrete mix. This tool allows the user to input the proposed fine and coarse aggregate gradings along with the proposed cement content. The excel spreadsheet then calculates the workability factor and the coarseness factor and plots the proposed grading of the aggregates onto the Coarseness Factor Chart in the excel spreadsheet.
The user can use this excel chart to determine whether the proposed grading of the aggregates for the concrete is suitable or not. Details on the different zones shown in the Coarseness Factor Chart Excel spreadsheet are explained below.
Coarseness Factor Chart Excel Method
The Coarseness Factor method is an empirical aggregate grading analysis method. This involves plotting the aggregate grading on a special chart which can be used to estimate the workability and potential for segregation of the fresh concrete mix.
Aggregate grading is an important consideration in concrete mix design. A poorly graded aggregate mix will be susceptible to segregation onsite and will not be sufficiently workable.
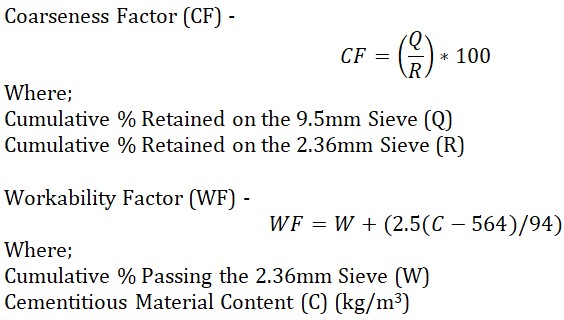
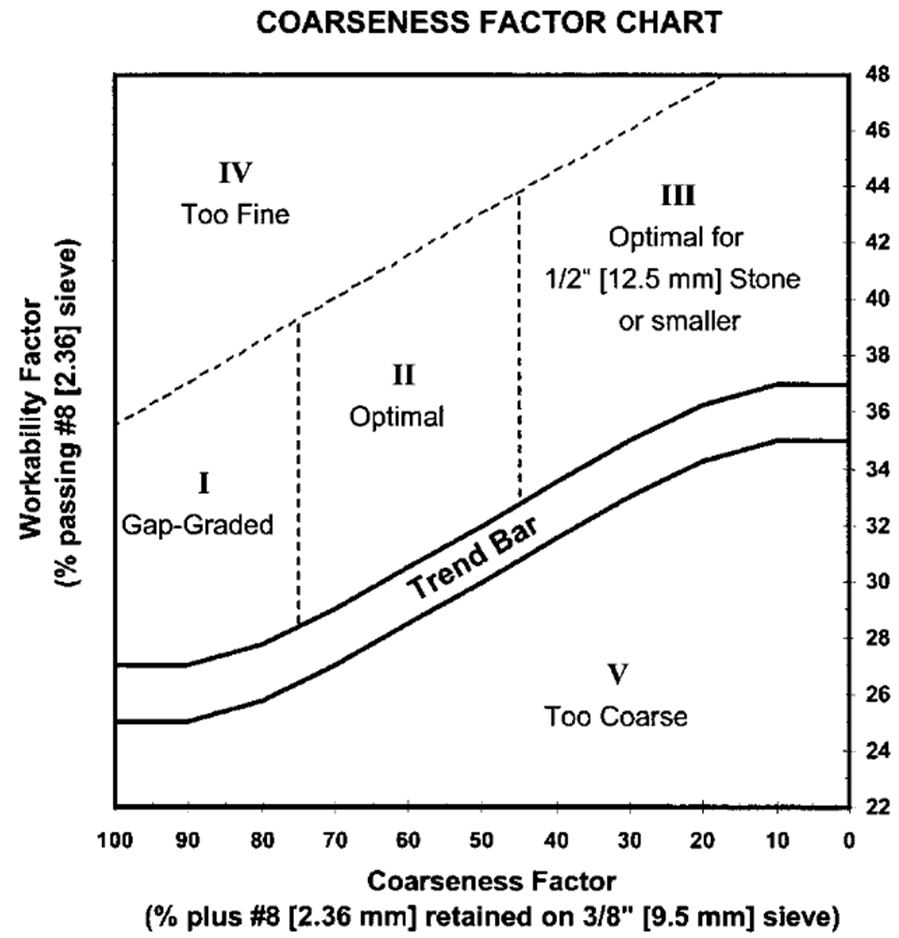
One method used in the US to ensure well graded aggregates is the Coarseness Factor method. This empirical method involves calculating a Coarseness Factor and Workability Factor using the equations given below and plotting these on a standard chart as shown below.
The chart shows a number of zones which estimate the concrete mix’s properties.
- Zone 1 – This area shows that the mix is gap graded. These mixes will have a high potential for segregation during production or compaction and pavements constructed with these mixes are often susceptible to localized cracking, blistering, spalling and scaling defects. They can be identified in the field as they are not cohesive, there will be a clear separation between the mortar and the coarse particles.
- Zone 2 – This is the optimum range for concrete pavement mixes with nominal maximum aggregate sizes between 20mm and 50mm. Mixes in this range will typically produce consistent, workable and high quality concrete pavements.
- Zone 3 – This zone can be the optimal range for concrete mixes with nominal maximum aggregate sizes smaller than 20mm.
- Zone 4 – This zone indicates that the mix has excessive fines content. These mixes will produce concrete with variable strength, high shrinkage, curling and cracking and are susceptible to spalling and scaling defects. There will also be a high risk of segregation during concrete production and compaction.
- Zone 5 – This zone indicates that the mix has an excessive amount of coarse aggregates and will not be sufficiently workable.
- Trend Bar – This zone indicates that the mix includes a near perfect balance between crushed aggregates and natural sands which will allow the fine aggregates to fill the voids between the coarse aggregates. It is difficult to consistently produce aggregate mixes which sit in this zone.
Coarseness Factor Chart Excel Spreadsheet
The Coarseness Factor Chart Excel spreadsheet is included in the CivilWeb Grading of Aggregates in Concrete Analysis excel spreadsheet. This analysis tool includes the Coarseness Factor Chart method along with two other methods to allow the designer to fully analyze the suitability of the proposed grading of aggregates for a concrete mix. This powerful analysis tool can be purchased directly for £5 or is included for free with the Rigid Pavement Design Suite.
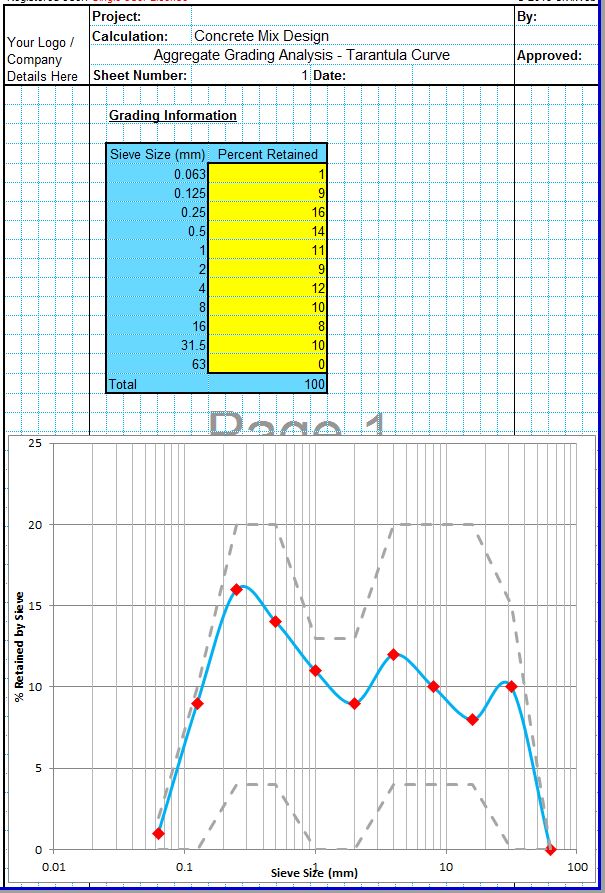
The tool also includes two complimentary analysis techniques along with the Coarseness Factor Chart method, the 0.45 Power method and the Tarantula Curve method.
Our full Concrete Properties Suite of spreadsheets is available for only £10.
Download Free Trial Version
To try out a fully functional free trail version of this software, please enter your email address below to sign up to our newsletter.
