The Minimum Fall for Sewer Pipes is determined to ensure that the water reaches a minimum velocity when running full. The minimum velocities in drainage pipes are specified to prevent the pipe from becoming blocked with sediments. If the pipe regularly achieves the specified minimum velocities it will effectively clean itself of sediments periodically, preventing the pipe from becoming blocked with sediments. While generic minimum velocities to achieve self-cleansing conditions have been specified in the past and continue to be specified such as 1.0m/s in Sewers for Adoption), recent research has shown that this is not really adequate with the pipe diameter and the sedimentation conditions playing a major role in determining the required minimum velocity.
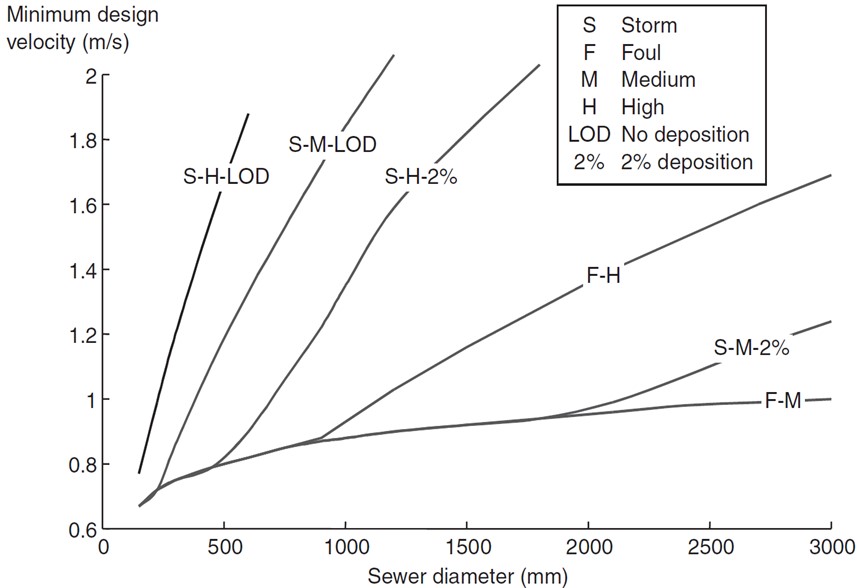
Detailed information on the design methodology is included below which culminates in the below graph which covers most common design conditions. As can be seen the requirement for 1.0m/s can be quite conservative in some cases.
Types and Quantities of Sediments found in Drainage Systems
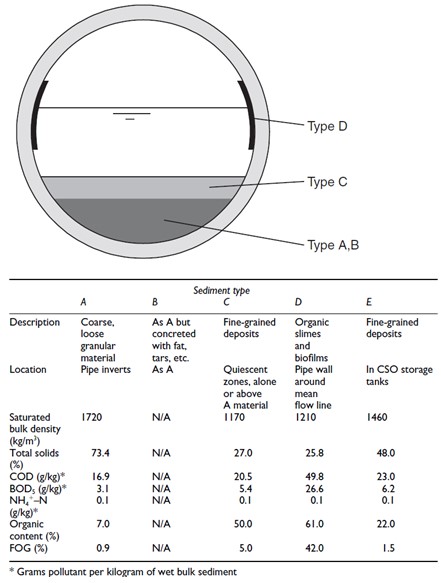
The main types of sediments found in drainage systems can be illustrated with the below diagram and table;
There are a large number of potential sources of sediments in drainage pipes. In foul sewers this can include the following;
- Large faecal and organic matter with a low specific gravity
- Smaller faecal and organic matter can form a slurry or sludge
- Paper, rags and other sewage litter flushed into sewers
- Vegetable matter and soil particles from domestic food preparation
- Materials from industrial or commercial sources
- Soil particles infiltrating into the pipe due to leaks and pipe defects
- Material from the pipe itself during deterioration
In storm water sewers the following sources of sediments can be found as well as some of the above;
- Silts, sands and gravels washed or blown from unpaved areas
- Detritus and litter from roads and paved areas
- Particles from vehicles such as rubber and particles from exhausts
- Atmospheric fallout onto paved surfaces and roofs
- Particles from the erosion of roofing materials
- Road grit from deterioration of the road surface or during maintenance
- Materials from construction works such as soils, aggregates and concrete slurries
- Illegally dumped materials
- Vegetative matter from trees and grass
- Grit from de-icing operations
The volume of sediment material from each of the above sources will vary from catchment to catchment and the likelihood of each should be assessed before a design is carried out. Some of the major sources of sediment are discussed below.
Material from the deterioration and maintenance of paved surfaces can be a major source of sediments in urban areas. These sediments can be introduced to the drainage system through general wear and tear of the road surface or during maintenance activities if the inlets have not been sufficiently blocked. Older and more damaged areas of paving are likely to generate more sediments than newer areas in better condition.
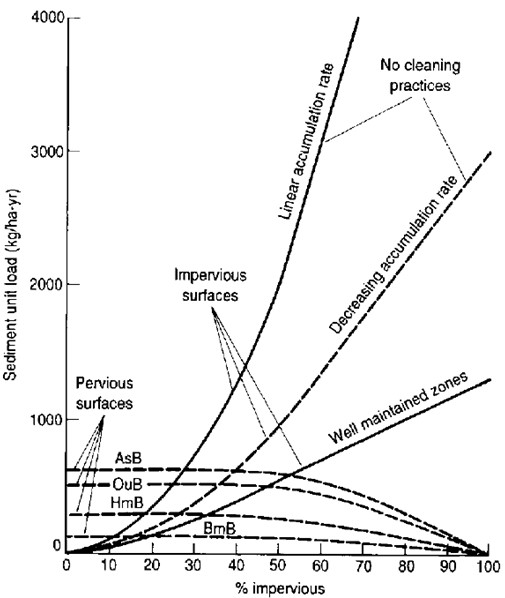
Soil loss from unprotected bare earth areas is considerable with annual loads of up to 100t/ha reported. Grassed areas are much better protected but will still release some solids to be washed into the drainage system. The below graphs shows the likely sediments loads from urban areas of different percentages of impermeable surfaces.
Construction sites can produced very large volumes of sediment in small periods of time. This is due to the exposure of natural soils, large volumes of used and stockpiled aggregates and solids transported by the movement of construction vehicles. For concreting works this is aggravated by the inclusion of waste concrete and concrete washout from mixers. One study saw an increase of sediments from 25kg/ha to 2,100kg/ha during construction works.
De-Icing operations are a major source of sediments in road drainage systems during winter. While large volumes of insoluble grit and solids are used on roads, they are only present for a short space of time and used on a relatively small area.
Quantity of Sediments
The following table taken from Ciria Report 141 gives a general idea of the concentrations of different sediment types expected in normal conditions.
The quantity of sediments expected from urban catchments can be estimated using guidance from the Highways Agency. This uses for risk factors derived from studies done in England. The following 4 factors are used;
- Land Use Factor (Fl) –
- Rural General = 1.0. This is suitable where adjacent land has a mixture of uses.
- Rural Grassland = 0.9. This is suitable where the adjacent land is mostly covered in grass.
- Rural Arable = 0.1. This is suitable where the adjacent land is used for arable farming.
- Rural Forested = 0.35. This is suitable where the adjacent land has a high number of trees.
- Geographical Location Factor (Fg)
- South West England = 1.0
- London, South and South East England = 0.1
- East Anglia = 17.0
- Midlands = 4.2
- Yorkshire and North West England = 6.2
- Lancashire, Cumbria and North East England = 1.5
- Road Size Factor (Fr)
- 2 lane carriageway = 0.4
- 3 land carriageway = 1.0
- 4 lane carriageway = 12.0
- Profile Factor (Fp)
- Level = 56.0
- Cutting = 1.0
- Embankment = 1.2
These factors are combined using the below equation to estimate the likely Total Site Specific Bed Load (Bs) (kg/m2);
The Primary Bed Load (Bp) is the volume of sediment generated by the area of road. This is typically taken as 0.05kg/m2 per year.
The total sediment which enters the drainage system has been measured at around 40% of the Total Site Specific Bed Load. A calculator tool is included with the CivilWeb Pipe Flow Calculator Spreadsheet.
Generally speaking solids of less than 150μm will be transported in suspension, and inorganic particles greater than 150μm will be deposited as bed load. The above table low, medium and high values are given to aid the designer in choosing an appropriate category. The low values would apply where particularly low sediment loads are expected or where well designed and maintained sediment interception methods are employed. The high value would be appropriate where particularly high loads of sediment are expected, for example near to a construction site.
Hydraulic Effects of Sedimentation
Where sedimentation has been allowed to take place this can lead to the following problems;
- The presence of sediments suspended in the water will reduce the flow capacity through energy losses caused by transporting the materials. It is thought that simply the presence of sediments in the runoff can reduce the flow capacity of the pipe by around 1-2% as energy is lost moving the sediments through the pipe.
- Sediments can build up, reducing the available size of pipe and therefore reducing the overall flow capacity of the pipe. In a pipe with sediment build-up of 5% of the diameter will lead to a loss of capacity of around 2% due to the smaller area available for the water. When the sediment bed reaches around 10% of the pipe diameter the flow capacity loss of the pipe becomes much more significant.
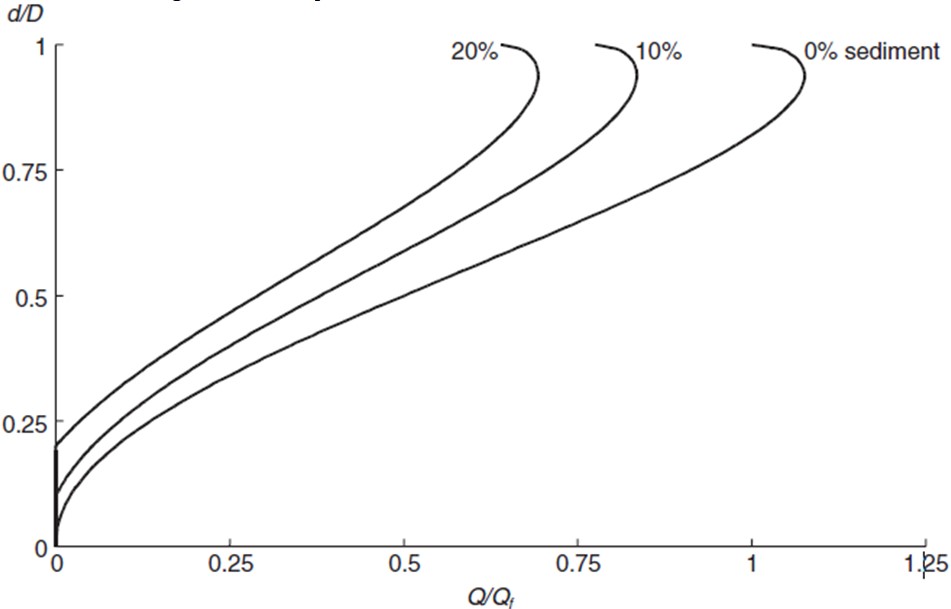
- Sediment beds present in the pipe can greatly increase the effective roughness of the pipe. Deposits moving along the invert quickly form into dunes and ripples which can increase the roughness coefficient of the invert to around 10% of the pipe diameter, much higher than the pipe values of between 0.6mm and 1.5mm. A bed of 5% the pipe diameter would lead to a loss of flow capacity of around 10%-20% in addition to the other losses described above. A graph illustrating this effect is presented below;
- The loss of energy and flow capacity caused by the above effects can then worsen the sediment deposition due to lower velocities in the pipe.
- Sediments building up inside a pipe can also lead to septicity in the pipe.
Simple Self-Cleansing Velocities
All drainage pipes will handle a certain amount of small sediments which enter the pipe with the runoff. This sediment will usually settle within the pipe and must be cleared to avoid the pipes flow capacity reduced and eventually becoming blocked. The best way to remove these sediments is to allow the drained water to clear the pipe during storm events, rather than rely on expensive regular jetting or other maintenance activities.
A drain is considered to be self-cleansing when there is a balance in the rate of deposition and erosion in the pipe which maintains a suitable depth of sediment. The depth of sediment should not reach levels where the capacity of the pipe is significantly affected or where maintenance efforts are required.
In order to achieve this, drainage pipes must be designed for the water to flow at self-cleansing velocities. The water must flow fast enough to transport small sediments in suspension, to move coarser material along the pipe invert and to erode any deposits which form on the pipe invert during periods of low flow such as during prolonged dry weather for storm drains.
This self-cleansing velocity is often stated as a requirement in national standards. The requirements for a drain to be self-cleansing however can be a complex calculation as it depends on the pipe diameter, runoff and sediment characteristics and flow rates patterns.
For preliminary and small scale design there are a number of standard minimum velocities and gradients which have been proposed. Many standards and publications simply advise that a minimum velocity is allowed for at a particular flow rate. BS EN 16933-2 states that small diameter drainage pipes less than 300mm diameter can be designed with either a velocity of 0.7m/s daily, or that the pipes should be laid at a gradient steeper than the pipe diameter, ie a 150mm pipe should be laid at a gradient of at least 1 in 150. Surface water drains up to 900mm diameter should be designed for a minimum velocity of 1.0m/s in pipe full conditions. Sewers for Adoption similarly recommends a value of 1.0m/s at full flow for storm sewers and a minimum velocity of 0.75m/s at one third design flow for foul sewers.
More Complex Calculations
Simple minimum velocities and gradient rules of thumb do not however take into account many important factors. For more detailed design of self-cleansing conditions the following factors must be considered;
- Pipe Diameter – It has been shown that larger diameter pipes require a higher velocity to maintain self-cleansing conditions.
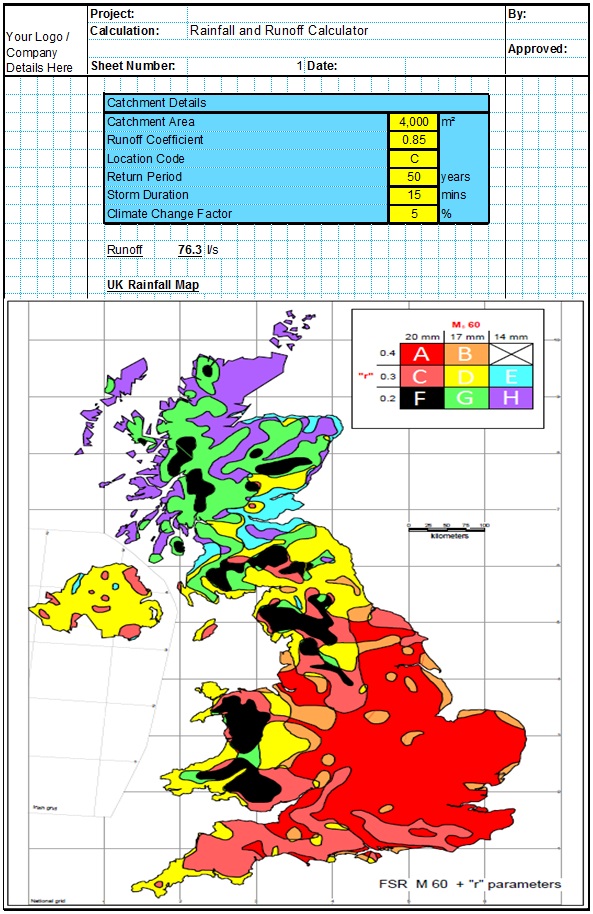
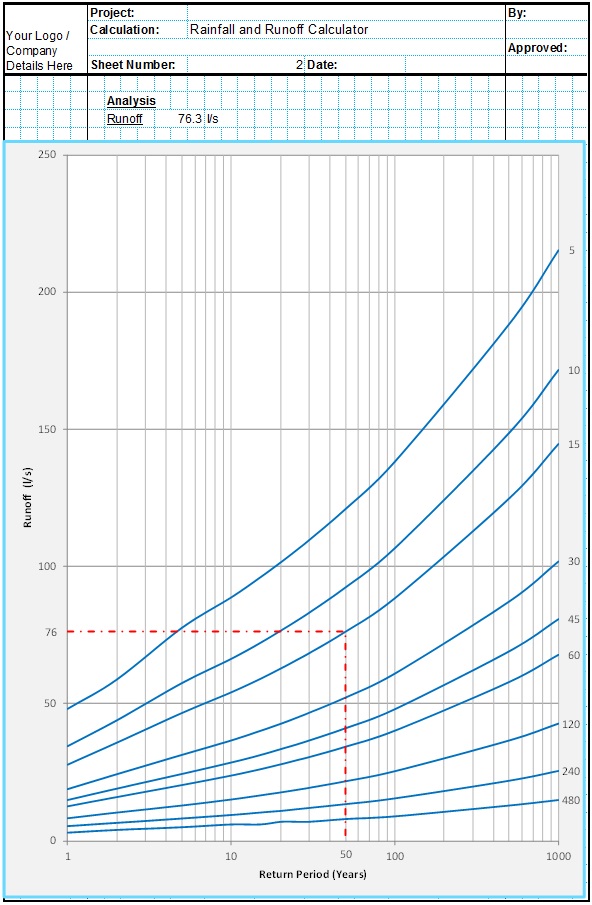
- Flow Conditions - The requirements will vary depending on the type of flow also. Foul sewers will typically run at a fairly regular flow, therefore the design minimum velocity should be calculated at mean flow. For surface water drains the flow may often reduce to zero in dry conditions, therefore the design minimum velocity should be calculated for a flow corresponding to a fairly regular storm event. This might be an event with a monthly occurrence for example. The flows associated with different sized storm events should be calculated using runoff analysis such as the CivilWeb Rainfall and Runoff spreadsheet.
- Flow Capacity – Drains are often overdesigned for future expansion or just to suit local gradients or standard pipe sizes. Where a drain is significantly larger than required for the flow conditions, velocities will be lower than if the pipe was sized correctly.
- Long Design Return Periods - This can also be an issue for pipes designed to carry rainfall from long return period storm events. Again the pipe will be oversized compared with the conditions in normal operation. Therefore the minimum velocity requirements must be sized to a more regular rainfall event, such as monthly or 6 monthly rather than the 10 year plus event the drainage is designed for.
- Sediments Present in the Runoff – Sediments can be larger or greater in quantity in different locations. Some examples of areas with high sedimentation include areas where windblown sand may be present, drains serving poorly maintained roads or unpaved areas or near construction sites, quarries or other activities which increase the sediment loads on the system. Some sediments, particularly in foul sewers can form a sediment bed which has a certain amount of cohesive strength, which will take greater force to erode than isolated particles.
- Construction Tolerances – In some cases where very shallow gradients would be suitable construction tolerances would need to be considered. Values of around 0.3% for small diameter pipes and 0.1% for large diameter pipes is often stated as a minimum to ensure that construction tolerances cannot leave some sections of the drain flat or back draining.
In general it has been found that more complex design methodologies return values higher than 1.0m/s in the following cases;
- For foul sewers larger than 1.0m diameter with high sediment loadings
- For all sewers larger than 2.1m diameter except where sediment loadings are low or a deep sediment bed greater than 2% of the pipe diameter can be tolerated
- For all sewers larger than 600mm diameter carrying high sediment loads
- For all sewers larger than 300mm where no sediment deposition can be tolerated
While the rough guidelines contained in national standards will often be sufficient to ensure self-cleaning conditions, in other cases they will not be adequate. This is particularly the case with large sewers or where large concentrations of sediment are present in the runoff. In these cases a more complex analysis will need to be carried out.
Ciria Report 141 combined a number of new studies with existing data to formulate a new design procedure which covers most of the applicable design situations encountered. These typical design situations includes foul sewers larger than 1,000mm diameter with high sediment loadings, storm sewers larger than 2,100mm where a sediment bed exceeding 2% of the diameter is not suitable, for surface water sewers larger than 600mm carrying large sediment loads and surface water sewers larger than 300mm where no sediment deposition can be allowed.
The more complex design methodology is considered superior to the simple minimum velocity as it allows the designer to ensure there will be no sedimentation problems under a much wider range of conditions, it can provide a more economical design particularly where frequent maintenance would otherwise be required, and it allows an assessment of existing sewers to be undertaken. The new methodology also can recommend shallower gradients for small diameter pipes in some cases which can be more economical. The designer must however confirm with the client that they can relax the simple requirements in standards such as Sewers for Adoption.
Complex Design Methodology
Studies undertaken as part of Ciria Report 141 ascertained that the sediment transportation capacities of flow in pipes was greater at around one third flow than it was at full bore. This means that it is adequate to use the full bore flow and velocity as a design condition assuming that much lower flows will still achieve the same or better self-cleansing conditions. In general the following procedure is shown for full bore flow.
Adjusted Geometrical Pipe Properties
The presence of a deposited sediment bed affects the geometry of the pipe available to carry water. The sediment bed reduces the area of pipe available while only slightly reducing the hydraulic radius. These effects can be calculated using a tool included in the CivilWeb Pipe Flow Calculator Spreadsheet. The geometric effects on the discharge are insignificant with small deposited sediment beds of 1%-2% of the pipe diameter. At these depths the effects of the bed roughness are much more important, as explained below. Even at depths of around 10% the geometric effects on discharge are still small, as can be seen in the below table;
Composite Roughness
Where a deposited bed of sediment is expected, the altered hydraulic properties of the pipe must be calculated to allow for the design sediment bed depth.
Bed Roughness (kb)
The roughness of the sediment bed for full bore flow can be calculated using the following formula;
Pipe Diameter (D)
This is the internal pipe diameter.
Median Sediment Size (d50)
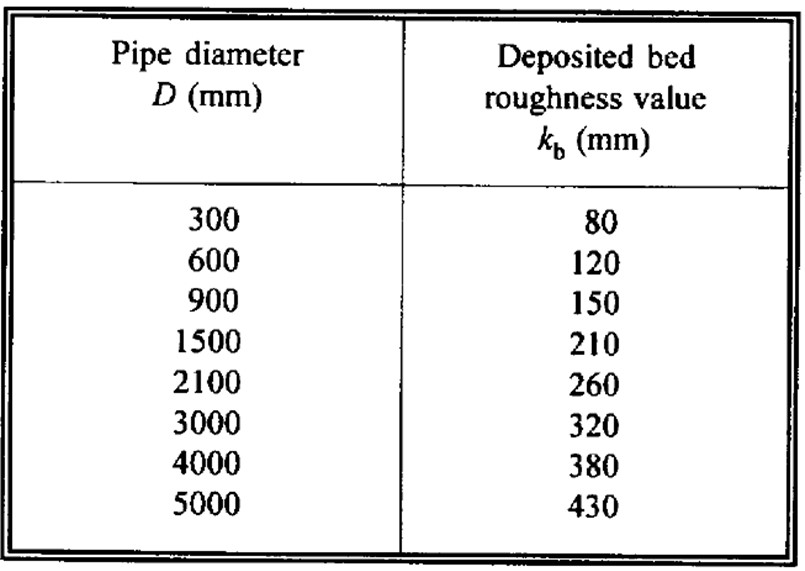
This is the size of the median sediment particles expected in the runoff. The above table reproduced from Ciria R141 shows some typical particle sizes for bedload grit. The following table shows typical bed roughness values for grit of 1mm.
Composite Roughness (kc) Calculation
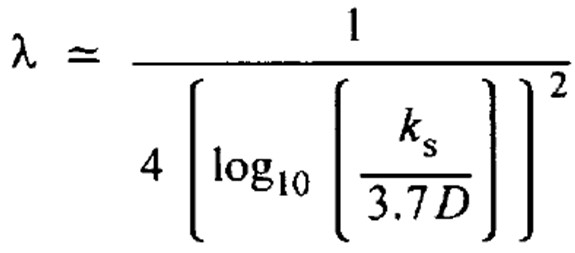
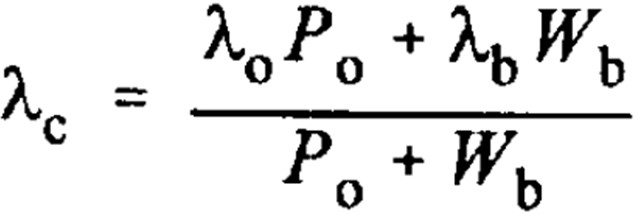
The composite value of the pipe roughness and the expected bed roughness can be calculated by averaging the two Darcy-Weisbach Friction Factors weighted by their relative perimeters. The Darcy-Weisbach Friction Factors can be calculated using this simplified equation;
Then the composite Darcy-Weisbach Friction Factor (λc) is calculated using the below equation;
The composite Darcy-Weisbach Friction Factor (λc) can then be converted to a composite roughness value (kc) using the below rearranged equation;
A series of tables are produced in Ciria R141 and in HA to help the designer avoid completing the complex calculations above by hand. The CivilWeb Pipe Flow Calculator Spreadsheet includes a tool which can complete these calculations for all pipe sizes and sediment bed depths.
Sediment Transport Equations
There are five design criteria which must be evaluated when considering the sediment transport requirements for a drainage pipe. Each is discussed in detail below.
Criteria 1 - Sediments in Suspension With No Deposition Allowed
The pipe can be considered to transport all fine sediments in suspension and all larger sediments in flume traction along the invert without significant deposits forming. This eliminates the need to evaluate the pipes hydraulic properties to account for a sediment bed, but the velocities and gradients required to achieve this can be impractical in many common design cases.
Suspension Check
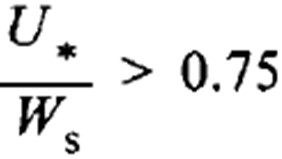
The following equation is first used to determine if the sediments are small enough to be transported in suspension;
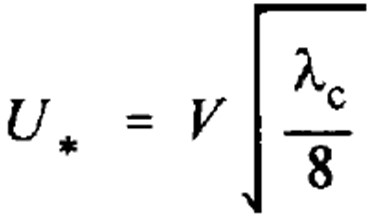
Overall Shear Velocity of Flow (U*)
The overall shear velocity of the flow is related to the mean flow velocity (V) and the composite friction factor of the pipe (λc). This is shown in the below equation;
Related Spreadsheets from CivilWeb;
Fall Velocity of the Sediment (Ws)
This can be estimated from the particle size (d), the specific gravity (Sg) and the kinematic viscosity of the water (v). This is shown in the below equation;
Kinematic Viscosity of Water (v) (m2/s)
This describes the viscosity of the liquid, water in this case. The kinematic viscosity is the absolute or dynamic viscosity divided by the liquids density at that temperature. The kinematic viscosity of water is around 1.139 mm2/s at 15°C which is the value usually used for design. This value does vary depending on the temperature of the liquid but the impact on the Colebrook-White equation is minimal so this variation is usually ignored. For a particular water temperature (T), the kinematic viscosity (in m2/s) can be estimated using the below equation;
A calculator tool is included in the CivilWeb Pipe Flow Calculator Spreadsheet to estimate kinematic viscosity at different water temperatures using the above equation.
Specific Gravity (s)
This is the specific gravity of the sediment particles. Typical values are shown in the table reproduced below.
Macke Equations – Sediment in Suspension
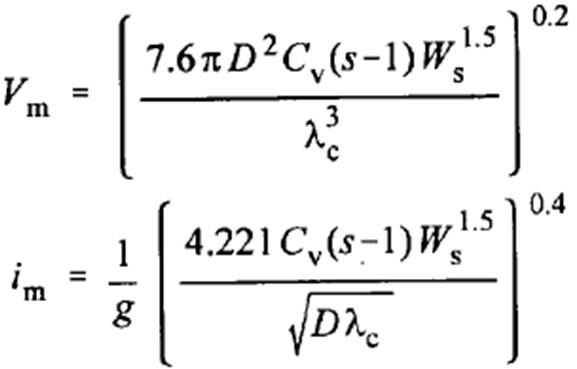
If the sediments are small enough to be transported in suspension and there is no allowance for a sediment bed, the following equations by Macke can be used to determine the minimum velocity or gradient required.
Minimum Velocity at Full Flow (Vm)
This is the minimum velocity at which the sediments will be transported in suspension.
Minimum Pipe Gradient (im)
This is the minimum pipe gradient required to achieve the above minimum velocity.
Gravitational Constant (g) (m/s2)
This is the acceleration due to gravity, typically taken as 9.81m/s2 at sea level.
Pipe Diameter (D)
Concentration of Sediments (Cv)
This is the concentration of sediments in the flow so can be derived from the volume of sediments divided by the volume of water. Typical values used for design are 50mg/l, 350mg/l and 1,000mg/l.
Fall Velocity of the Sediment (Ws)
As calculated above.
Composite Darcy-Weisbach Friction Factor (λc)
As calculated above. For Macke’s equation it is assumed that there is no sediment bed, so the friction factor value should be calculated for the pipe with no sediment bed.
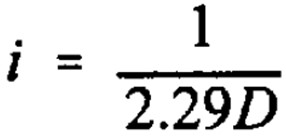
In addition to the above equations, Macke also recommended a minimum average shear stress of 1.07N/m2. This requirement can be rearranged to calculate a minimum gradient for the pipe based on an inversely proportional relationship with the pipe diameter (D) in mm;
This minimum gradient can then be converted to a minimum velocity using the Colebrook White Formula. The design value used in this condition should be the maximum of the two above equations. Completing these calculations by hand is very laborious and often needs to be done for a number of different pipe diameters and sediment characteristics. The CivilWeb Pipe Flow Calculator Spreadsheet calculates these parameters and plots the results so the user can see the required velocities for different pipe diameters at a glance.
Criteria 2 - Sediments Transported as Bedload With No Deposition Allowed
If coarse sediments are to be transported as bedload but without any allowance for a sediment bed, the following equations can be used to calculate the minimum velocity;
Minimum Velocity (V)
Threshold Velocity (Vt)
Gravitational Constant (g) (m/s2)
This is the acceleration due to gravity, typically taken as 9.81m/s2 at sea level.
Pipe Diameter (D)
Concentration of Sediments (Cv)
This is the concentration of sediments in the flow so can be derived from the volume of sediments divided by the volume of water. Typical values used for design are 50mg/l, 350mg/l and 1,000mg/l.
Pipe Area (A)
Particle Size (d)
This is the size of the median sediment particles expected in the runoff. This table reproduced from Ciria R141 shows some typical particle sizes for bedload grit.
Specific Gravity (s)
This is the specific gravity of the sediment particles. Typical values are shown in the table reproduced above.
Depth of Flow Relative to the Invert (y)
This is the depth of flow above the invert. As this calculation is usually completed for full flow conditions, this can be taken as the pipe diameter.
The above equations must be solved iteratively as the Threshold Velocity is in the equation for Concentration of Sediments. This is done automatically in the CivilWeb Pipe Flow Calculator Spreadsheet.
Criteria 3 & 4 - Sediments in Suspension (3) or Transported as Bedload (4) With a Sediment Bed Allowance
In some cases it is economical to allow for a small sediment bed of around 1% to 2% of the pipe diameter depth in the bottom of the pipe. This sediment bed affects the flow of the water in the pipe and therefore its sediment carrying capacity.
The equations describing this process are complex and require multiple iterative approaches to solve for the design parameters. For this reason Ciria Report 141 produced two sets of design tables which can be used for the design of typical drainage pipe systems. These tables were produced for the Ackers-White method for sediment carried in suspension in pipes with as sediment bed, and the May method for sediments transported as bed load over a deposited sediment bed in a pipe. The CivilWeb Pipe Flow Calculator Spreadsheet is based on these design tables, which are reproduced in Appendix H and I.
Criteria 5 - Self-Cleansing Velocities
Generally some sediment deposits are expected to occur in most pipes as a result of deposition occurring at low flows. The pipe must be able to clean away these sediments when the pipe runs at full flow.
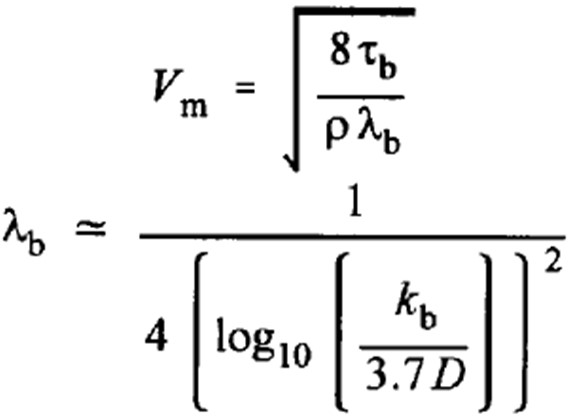
This self-cleansing condition requires that a minimum bed shear stress of at least 2.0N/mm2 is achieved. This assumes a 1mm cohesive sediment particles with an associated minimum bed roughness (kb) of 1.23mm. With these criteria, the following equations can be used to calculate the minimum velocity required;
Minimum Velocity (Vm)
Minimum Bed Shear Stress (τb)
This is the minimum bed shear stress required to clean the pipe of cohesive sediments when the pipe is running full.
Friction Factor for Deposited Bed (λb)
This is the friction factor calculated for the above conditions.
Pipe Diameter (D)
Water Density (ρ)
This can generally be assumed to be 1,000kg/m3.
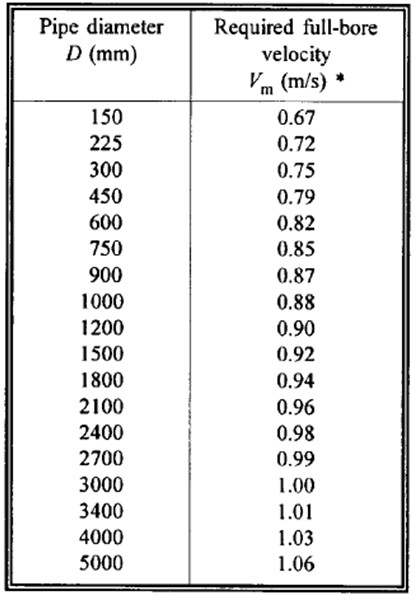
The application of this formula produces the following table, which can be taken as a minimum self-cleansing velocity for all pipe sizes. This should then be adjusted to allow for any higher velocity requirements of any of the other applicable design conditions described above.
Design Procedure
If a complex calculation is justified by the project conditions, this can be undertaken using the CivilWeb Pipe Flow Calculator Spreadsheet. The spreadsheet allows the user to define 5 sedimentation criteria, one for each of the below conditions;
- Criteria 1 - Sediments in suspension with no deposition allowed
- Criteria 2 - Sediments transported as bedload with no deposition allowed
- Criteria 3 - Sediments in suspension with a sediment bed allowance
- Criteria 4 - Sediments transported as bedload with a sediment bed allowance
- Criteria 5 - Self-cleansing velocities
The CivilWeb Pipe Flow Calculator Spreadsheet can complete one calculation for each of the above criteria, then the minimum velocities are tabulated in a summary sheet, allowing the designer to clearly see which criteria is critical and what the minimum velocity is to achieve all of the design criteria.
Ciria 141 includes a large number of simplified design tables calculated using the above procedure. These tables cover the majority of common design problems and are designed to enable the designer to avoid very complex calculations for common design conditions and for preliminary design. While the application of design software or a spreadsheet such as the CivilWeb Pipe Flow Calculator Spreadsheet enables the designer to complete the complex calculations, the design tables are useful for quick reference. These design tables have also been converted into a very useful graph shown below.
Get your copy of the CivilWeb Pipe Flow Calculator spreadsheet including a full sedimentation analysis tool now for only £20.
Or why not bundle the CivilWeb Pipe Flow Calculator with our Rainfall Calculator Spreadsheet for only £5 extra?
Runoff Calculator Spreadsheet
This spreadsheet calculates the design runoff flow for a site in accordance with the a number of different methods including the Wallingford Procedure.
Full Drainage Design Suite
Full drainage design suite (50% Discount) including 6 spreadsheet suites;
- Pipe Flow Calculator
- Manning Open Channel Design
- Linear Drainage Design
- Runoff Calculator
- Attenuation Design
- Soakaway Design
