The 0.45 Power Gradation Chart Excel Spreadsheet is included within the CivilWeb Grading of Aggregates in Concrete Analysis excel spreadsheet as a tool which can be used for the analysis of aggregate gradings in concrete. This tool allows the user to input any proposed combined grading of aggregates. The excel spreadsheet then plots the proposed aggregate gradings onto a 0.45 Power Gradation Chart in the excel spreadsheet which the designed can use to determine the suitability of the proposed grading of aggregates. The designer can also see at a glance exactly where the aggregate grading needs to be altered in order to optimize a continuously graded aggregate mix for the concrete.
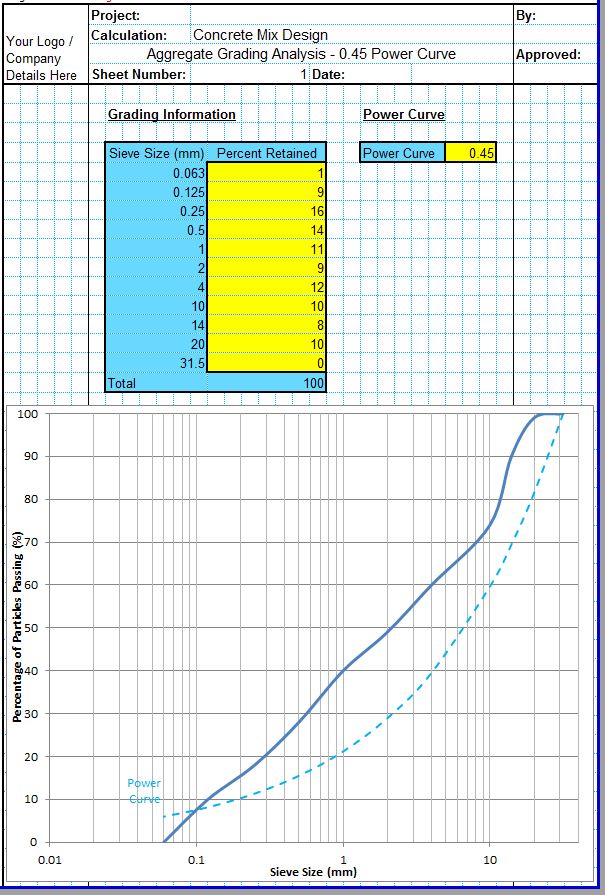
0.45 Power Gradation Chart Excel Method
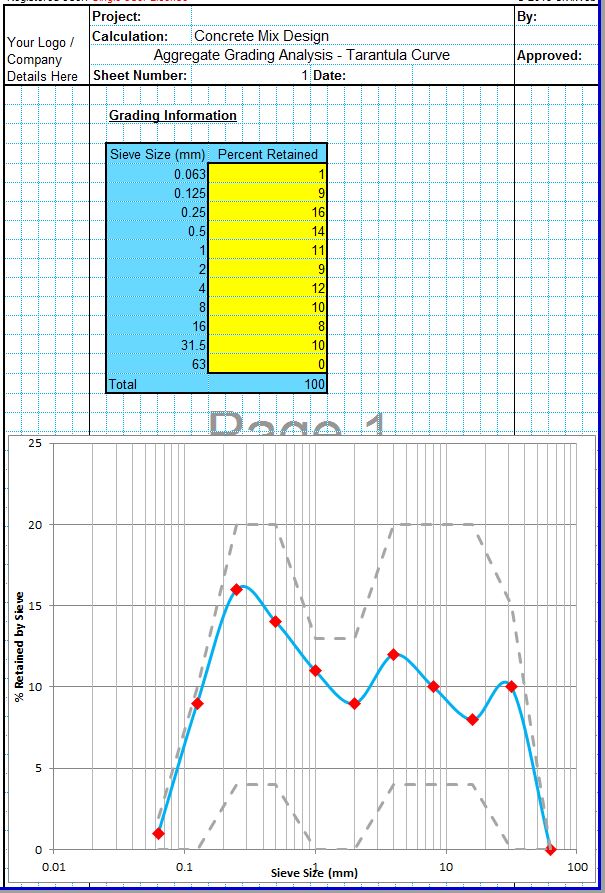
The 0.45 Power Gradation Chart method is a technique used to analyze and optimize the grading of aggregates within concrete or asphalt. Several other methods are used to optimize aggregate gradings in concrete including the Coarseness Factor Chart method and the Tarantula Curve method.
The grading of aggregates is very important in order to ensure that the aggregate and cement paste matrix contains the correct proportions of aggregates and paste. This affects the workability and consistence of the fresh concrete. The aggregate grading can also be optimized to reduce the quantity of cement required reducing the cost.
0.45 Power Gradation Chart – Origins
The 0.45 Power Gradation Chart method originated in the asphalt industry and was developed by Nijboer in an attempt to describe the ideal combined aggregate gradation for asphalt pavements.
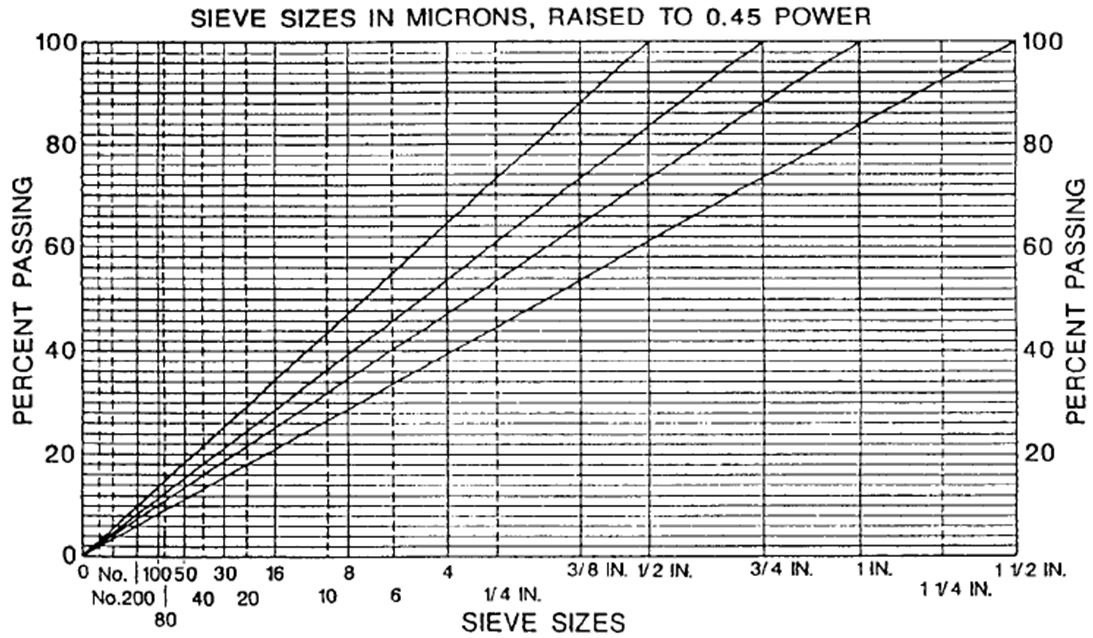
This involved a graphical method whereby a chart is created with the log of the sieve opening sizes on the X axis and the percent passing on the Y axis. A continuous grading would produce a straight line on this chart from the origin to the maximum aggregate size passing 100%. Such a continuous grading would improve the workability of the fresh concrete, reducing water content and therefore increasing strength.
0.45 Power Method Gradation Chart – Typical Uses
The 0.45 Power Gradation Chart method is often used in gradings of aggregates for asphalt and for roller compacted concrete or hydraulically bound materials. In this method the aggregate gradings are plotted on a cumulative percent passing graph with the sieve sizes raised to the power of 0.45. Many different power relationships have been proposed but 0.45 is the most commonly used. A straight line on this graph from the origin to the maximum aggregate size indicates the optimum grading for density, as shown below (note US units).
The modified Fuller-Thompson grading curve for asphalt mixes can be used to produce this continuous grading. The below equation will produce a straight line on the above graph;
Cumulative Percent of Particles Passing the Sieve (P)
Sieve Opening Size (d)
Nominal Maximum Aggregate Size (D)
0.45 Power Gradation Chart – Limitations
An aggregate grading following the 0.45 Power Gradation Chart method will produce the maximum possible density of aggregate materials, minimizing voids and therefore water and cement requirements. This relationship is much more commonly used in asphalt or for roller compacted concrete where density is the most important consideration and the required workability of the mix is much less than conventional concrete.
Conventional concrete construction often does not require such a closely controlled aggregate grading as roller compacted concrete or asphalt, and for this reason the 0.45 Power Gradation Chart method is not commonly used. It is however a useful tool for some concrete pavement works where workability and density of the finished concrete must be optimized and can be used on most concrete projects to reduce costs. This is particularly the case for larger pours where aggregates are cheaply available.
Also in conventional concrete the fines include cementitious materials which means the aggregate grading will drop off the 0.45 Power Method line for fine materials. For these reasons the 0.45 Power Method is not commonly used in conventional concrete design, it is however sometimes used for evaluating proposed aggregate mixes.
0.45 Power Gradation Chart Excel Spreadsheet
The 0.45 Power Gradation Chart Excel spreadsheet is included in the CivilWeb Grading of Aggregates in Concrete Analysis excel spreadsheet. This analysis tool includes the 0.45 Power Gradation Chart method along with two other methods to allow the designer to fully analyze the suitability of the proposed grading of aggregates for a concrete mix. This powerful analysis tool can be purchased directly for £5 or is included for free in the Rigid Pavement Design Suite.
The tool also includes two complimentary analysis techniques along with the 0.45 Power Gradation Chart method, the tool includes analysis modules based on the Coarseness Factor Chart method and the Tarantula Curve method.
Buy the CivilWeb Grading of Aggregates in Concrete Analysis Spreadsheet now for only £5.
Our full Concrete Properties Suite of spreadsheets which includes the Grading of Aggregate Analysis spreadsheet is available for only £10.
Download Free Trial Version
To try out a fully functional free trail version of this software, enter your email address below to sign up to our newsletter.
