The performance of the soakaway depends largely on the infiltration rate of the surrounding soils. Infiltration rate describes the rate at which water is able to infiltrate through the unsaturated soils surrounding the soakaway.
Minimum Soil Infiltration Rates
Some guides specify a minimum infiltration rate of around 1x10⁻⁶ m/s. Soakaways constructed in soils with infiltration rates lower than this value will generally be very slow to empty and therefore will not comply with the requirement for soakaway emptying time. However, for very small catchments they could still be used. Note that even where infiltration rates are too low for soakaways to handle the design storm runoff, they can still be useful for intercepting the first 5mm of rainfall or as part of attenuation storage.
Infiltration Rate from Soil Types
The infiltration rate is dependent on the physical properties of the soil. Generally the more open the macrostructure, the higher the infiltration rate.
For this reason homogenous clays are generally unsuited to soakaways as they can have very low infiltration rates. Soils with a clay content of more than 20% are generally unsuitable for infiltration.
Similarly some silts are also largely unsuitable, though this depends on the particle size. Soils with a clay/silt content greater than 40% are likely to be unsuitable. However, due to the smaller particle size of silty soils, they are less prone to becoming blocked by sediments entering the soakaway. As the sediments are likely to be a similar particle size to the silts, the sediment does not have a big impact on the soil infiltration rate. The designer may use this fact to justify a smaller factor of safety.
Sandy soils are usually suitable. However care must be taken that the sand layers do not clog up with sediments and the layer will remain stable in saturated conditions as the storm water infiltrates through the medium. Also, in the UK sandy layers often include significant quantities of clay which can reduce their infiltration rate significantly.
Gravel layers can be very suitable as their large particle size can lead to a high porosity and corresponding high infiltration rates. Gravel layers are however seldom homogenous and variable particle sizes and sand horizons can significantly reduce the infiltration rate. Gravel layers are also often relatively thin and also often do not extend a great distance horizontally which reduces their effectiveness at infiltrating large volumes of water. Similar to sands, in the UK gravelly layers often include significant quantities of clay which can reduce their infiltration rate significantly.
Typical Soil Infiltration Rate Values
For the purposes of preliminary design and feasibilities it is sometimes required to undertake an outline soakaway design before any detailed site investigation works have been undertaken. For these purposes typical design infiltration rates have been compiled. Typical values have been compiled based on a number of different soil classification systems including soil texture, USCS classifications and soil gradings.
Soil Texture
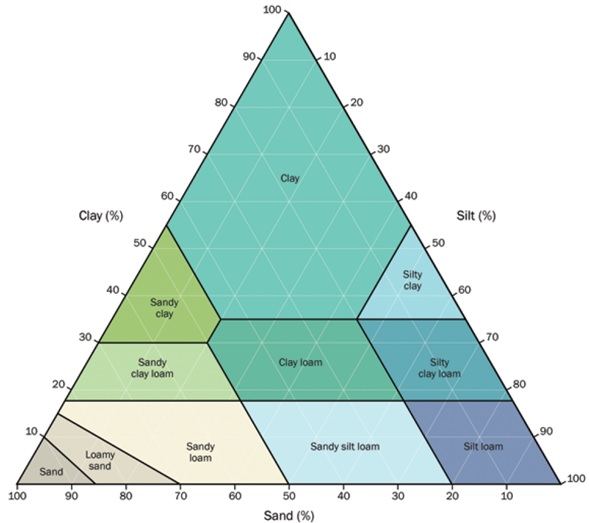
The soil texture classification system shown in the CIRIA SUDS Manual is not the same as the standard used in site investigation reports, though it does include a note of the equivalents, see below.
| Soil Texture | ISO 14688-1 | Lower (m/s) | Upper (m/s) |
| Gravel | Sandy GRAVEL | 3x10⁻⁴ | 3x10⁻² |
| Sand | Slightly silty slightly clayey SAND | 1x10⁻⁵ | 5x10⁻⁵ |
| Loamy Sand | Silty slightly clayey SAND | 1x10⁻⁴ | 3x10⁻⁵ |
| Sandy Loam | Silty clayey SAND | 1x10⁻⁷ | 1x10⁻⁵ |
| Loam | Very silty clayey SAND | 1x10⁻⁷ | 5x10⁻⁶ |
| Silt Loam | Very sandy clayey SILT | 1x10⁻⁷ | 1x10⁻⁵ |
| Sandy Clay Loam | Very clayey silty SAND | 3x10⁻¹⁰ | 3x10⁻⁷ |
| Silty Clay Loam | - | 1x10⁻⁸ | 1x10⁻⁶ |
| Clay | - | 0 | 3x10⁻⁸ |
| Till | - | 3x10⁻⁹ | 3x10⁻⁵ |
The SUDS Manual also includes a guide to the soil classification used, shown below.
USCS Classification
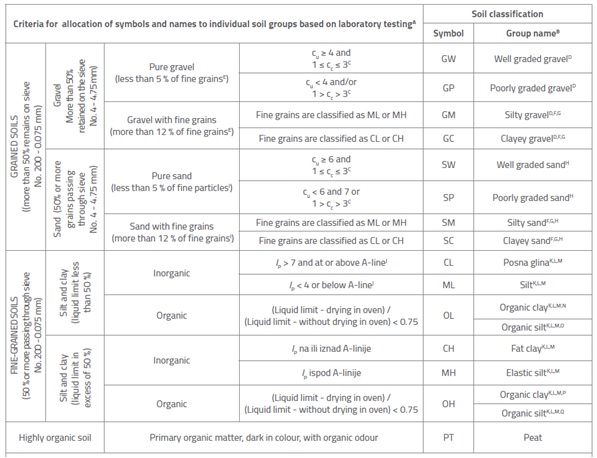
There are also typical infiltration rates which have been compiled for the USCS soil classification system. Details of the classification system and typical infiltration rates are given below.
| USCS Classification | Lower (m/s) | Upper (m/s) | |
| GW | Well Graded Gravels | 10-5 | 10-3 |
| GP | Poorly Graded Gravels | 5x10⁻⁵ | 10-3 |
| GM | Silty Gravels | 10-8 | 10-4 |
| GC | Clayey Gravels | 10-8 | 10-6 |
| SW | Well Graded Sands | 5x10⁻⁶ | 5x10⁻⁴ |
| SP | Poorly Graded Sands | 5x10⁻⁷ | 5x10⁻⁶ |
| SM | Silty Sands | 10-9 | 10-6 |
| SC | Clayey Sands | 10-9 | 10-6 |
| ML | Inorganic Silts (Low Plasticity) | 10-9 | 5x10⁻⁷ |
| CL | Inorganic Clays (Low Plasticity) | 10-9 | 10-8 |
| OL | Organic Silts (Low Plasticity) | 10-9 | 10-6 |
| MH | Inorganic Silts (High Plasticity) | 10-10 | 10-9 |
| CH | Inorganic Clays (High Plasticity) | 10-11 | 10-9 |
| OH | Organic Clays (High Plasticity) | 0 | 0 |
| PT | Peat | 0 | 0 |
Soil Gradings
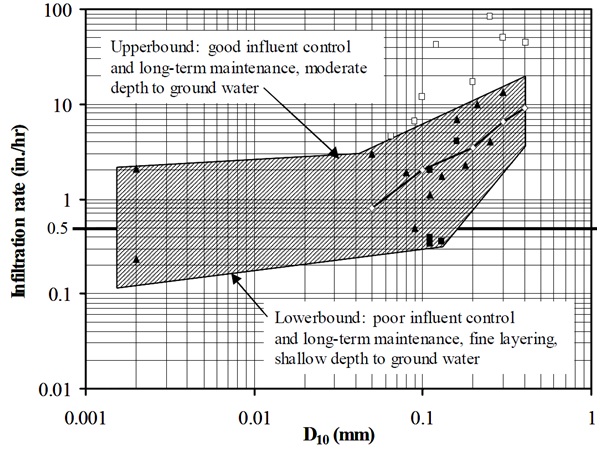
The soil gradings values are shown on the graph below. Note the Infiltration Rate is shown in in/hr.
Rock
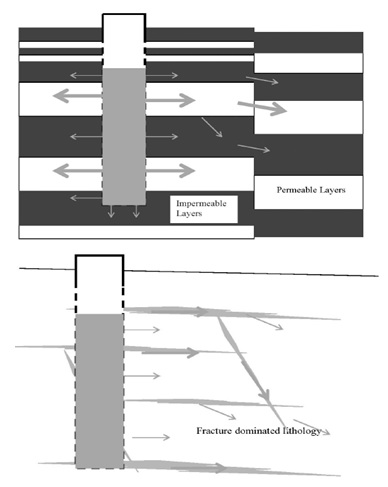
The permeability of rock layers is dependent on the precise lithology and structure of the formations. This can be quite different in the vertical and horizontal directions. In sedimentary formations of interbedded layers for example, the horizontal infiltration rate may be much higher than the vertical rate.
The overall infiltration rate is then largely dependent on the level of interconnection achieved through fractures and fissures between the layers with high infiltration rates. Where there is significant fracturing in an otherwise homogenous lithology, in some sandstones and granites for example, the infiltration rate will depend entirely by the number and size of the fractures which can be accessed by the soakaway. Examples of this are shown below.
Natural geological systems can be very complex with a number of different factors contributing to the infiltration rate achieved. Detailed investigation work will be required to estimate the infiltration rate at design stage. This can take the form of a falling or rising head test undertaken in accordance with BS 5930. This can be done when boreholes are installed for site investigation purposes. Ideally this should be done at each soakaway location as the lithology can be complex and variable. In practice it may also be prudent to test installed soakaways to ensure that they meet the required performance.
Similar typical infiltration values have been compiled for common rock formations. The actual infiltration rate achieved will depend on the homogeneity of the rock and whether any fractures or fissures are present.
| Rock | Lower (m/s) | Upper (m/s) |
| Chalk | 10-5 | 10-3 |
| Karst | 10-6 | 10-2 |
| Limestone | 10-9 | 10-6 |
| Sandstone | 10-10 | 10-6 |
| Siltstone | 10-11 | 10-8 |
| Salt | 10-12 | 10-10 |
| Anhydrite | 10-13 | 10-8 |
| Shale | 10-13 | 10-9 |
| Permeable Basalt | 10-7 | 10-2 |
| Factured Igneous Rock | 10-9 | 10-4 |
| Factured Metamorphic Rock | 10-9 | 10-4 |
| Weathered Granite | 10-6 | 10-5 |
| Weathered Gabbro | 10-7 | 10-6 |
| Basalt | 10-11 | 10-7 |
| Unfactured Igneous Rock | 10-14 | 10-10 |
| Unfactured Metamorphic Rock | 10-14 | 10-10 |
Site Specific Factors
The very large ranges given above are a measure of the massive level of uncertainty in estimating a rate of infiltration from a simple soil classification. The actual infiltration rates achieved onsite are a combination of many different factors, including those detailed below;
- Detailed soil conditions such as packing, macro and micro structure. These can have a big impact on the infiltration rate but require detailed site investigation to determine and may change significantly over small distances.
- Compaction level of soil. This can change significantly if it is trafficked or loaded during construction.
- The geology and lithology of underlying bed rocks. Any fractures or fissures in the rock formations can have a large effect on the infiltration rates achieved.
- Types of adjacent and underlying soils, particularly swelling clays.
- Vertical and horizontal extents of the soil layers. Any soils included in the design infiltration rate must have sufficient lateral extent to contribute fully to the emptying of the soakaway. For example, small pockets of sand or gravelly soils will simply become saturated before the soakaway can fully empty. This would lead to a much lower effective infiltration rate than that expected of a large layer of similar material.
- Runoff quality and interception of fines methodology. The level of fine sediments contained in the runoff can have a significant effect on the long term infiltration rates achieved.
- Soakaway maintenance quality and frequency. Similar to above regular maintenance will improve the infiltration rates achieved in the long term.
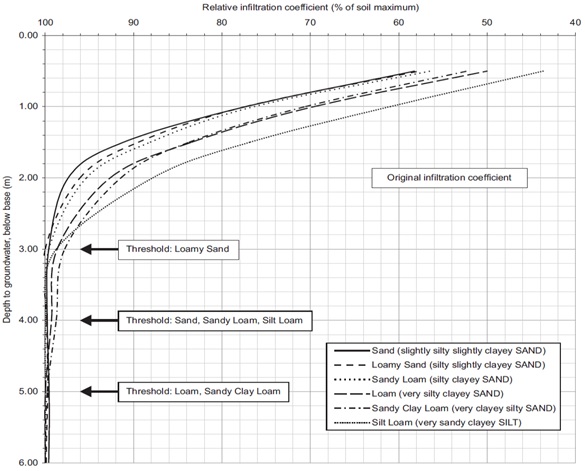
- Depth to groundwater. An empirical relationship for different soil texture classifications has been derived which can be used to adjust any estimated infiltration rates. It can also be used to adjust any infiltration rates measured onsite at times of low groundwater.
Related Spreadsheets from CivilWeb;
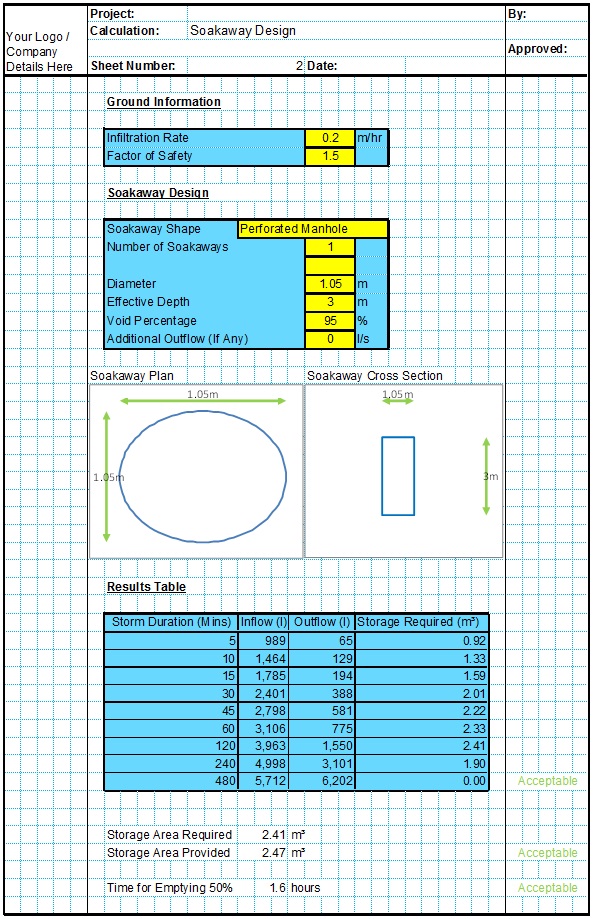
Soakaway Design Spreadsheet
This spreadsheet calculates the requirements for a soakaway system and assists the user to design a suitable system.
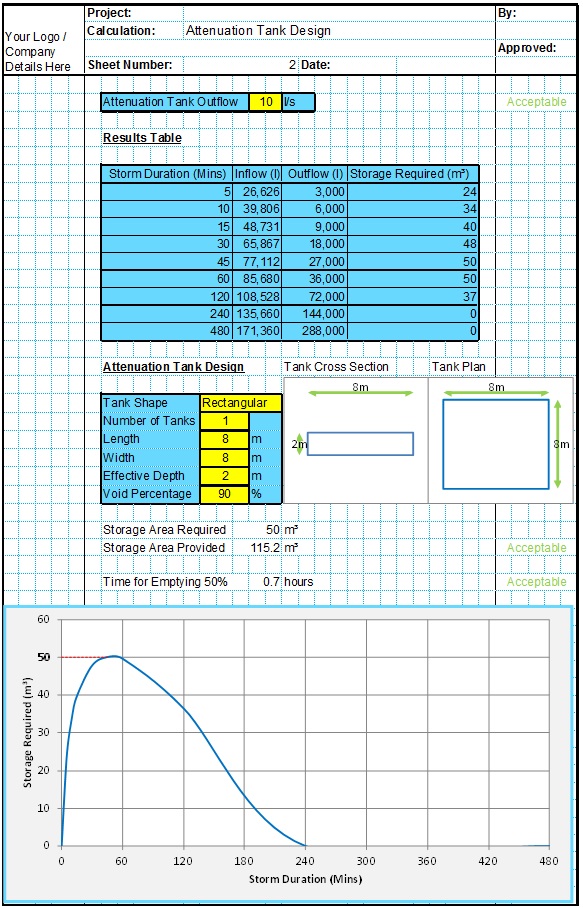
Attenuation Design Spreadsheet
This spreadsheet calculates the requirements for a attenuation system and assists the user to design a suitable system.
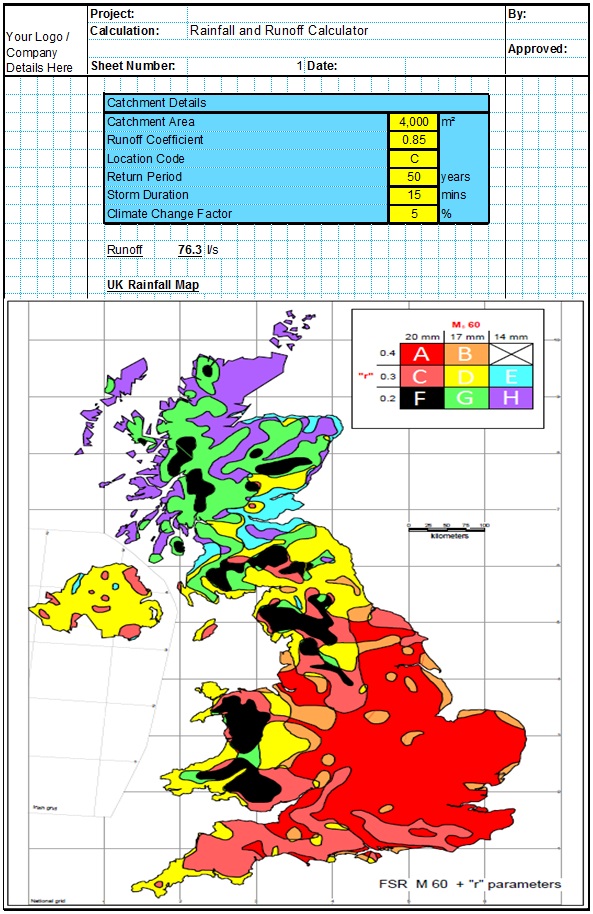
Runoff Calculator Spreadsheet
This spreadsheet calculates the design runoff flow for a site in accordance with the a number of different methods including the Wallingford Procedure.
Full Drainage Design Suite
Full drainage design suite (50% Discount) including 7 spreadsheets;
- Colebrook White Pipe Design
- Manning Pipe Design
- Manning Open Channel Design
- Linear Drainage Design
- Runoff Calculator
- Attenuation Design
- Soakaway Design
